
|
|
To know your fund performance & NAV Click here
|

|
|
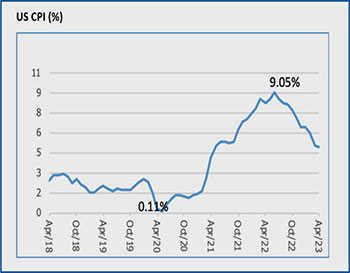
US CPI (%)
- US CPI for April’23 came in at 4.9% YoY, 10bps lower then the March
print increasing bets that the US Fed could pause its interest rate
hike cycle in June. However, core ination remained sticky at 5.50%
which pushed out market expectations of interest cut by Fed to
2024.
- The debt ceiling negotation took the center stage through the
month. However by the end of the month it was concluded with
spending freeze. From the market prespective any cut in spending is
scal postive and disinfaltionary.
|
|
|
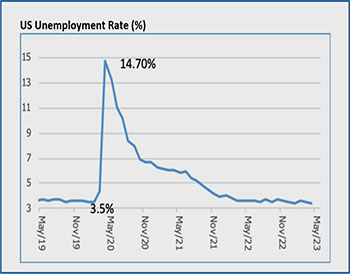
US Unemployment Rate (%)
- The US unemployment rate came surprsingly higher at 3.7% vs
3.4% for the month of May. Participation rate was at at 62.6%,
however the average hourly earnings slowed from 0.4% MoM in
April to 0.3% in May refelecting some slowdown in labour market.
- Non Farm Payroll data surprised sharply to the upside for May
printing at 339K. While upward revisions were made for April from
253k to 294k, the average monthly run rate for 2023 is tracking at
314K that is well above the 180K average witnessed in
the pre-pandemic period
|
|
|
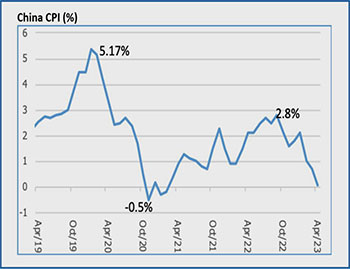
China CPI (%)
- Chinese CPI came in at 0.1% YoY for the month of April’23 Vs 0.7% in
the previous month this was the lowest print since Feb 21,amid
uneven economic receovery after removal of zero covid policy,with
prices of both food and non food easing sharply.
|
|

|
|
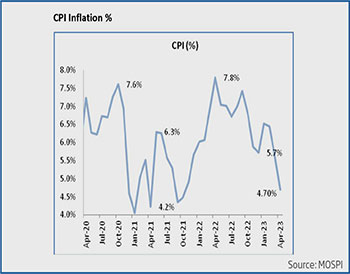
CPI Inflation %
- Ination (CPI) for Apr’23 stood at 4.7% vs 5.7% in Mar’23 as food CPI
which constitutes the 45.9% has moderated to 4.2% in Apr’23 from
5.1% in Feb’23.
- Fuel ination which constitutes 6.8% of the CPI basket has eased by
330bps to 5.5% in Apr’23 vs. 8.8% in Mar’23.
|
|
|
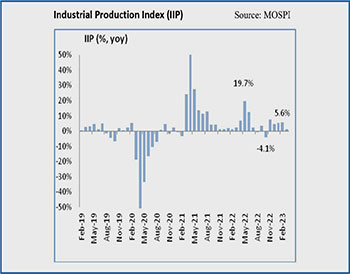
Industrial Production Index (IIP)
- Industrial Production (IIP) growth for Mar’23 came at 1.1% vs. 5.8%
growth during Feb’23 as Manufacturing output growth sharply
decelerated to 0.5% in Apr’23 vs 5.6% in Mar’23. However, Mining
output growth accelerated to 6.8% yoy in Mar’23 vs. 4.8% in Feb’23.
- The increase in the Industrial production index reects the gaining
momentum in production activities. Monthly IIP nos can be volatile
and dicult to draw a trend from the same.
|
|
|
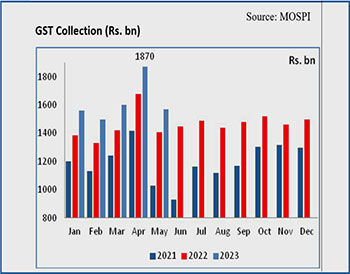
GST Collection (Rs. bn)
- GST revenues for the month of May’23 came at Rs. 1,571bn showing a
11.5% YoY as CSGT (13.5%), SGST (12%) and IGTS (10.9%)
increased sharply.
- Avg. monthly GST collections have increased to Rs. 1.5 lakh crore in
FY23 vs. Rs. 1.2 lakh crore in FY22 and Rs. 1 lakh crore in FY20
continuing to display very high buoyancy.
|
|
|
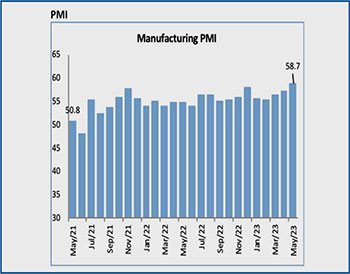
PMI
- Manufacturing PMI rose up to 58.7 in May’23 from 57.2 in Apr’23 on
continued strength in orders pipeline, production and despite a
slowdown being seen in the exports.
|
|
|
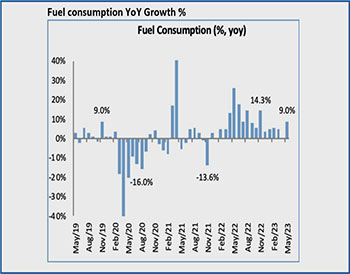
Fuel consumption YoY Growth %
- Fuel consumption growth stood at 9% in May’23 vs. 0.5% growth in
Apr’23. With in fuel category, consumption for petrol and diesel grew
11% and 12.8% respectively.
|
|
|
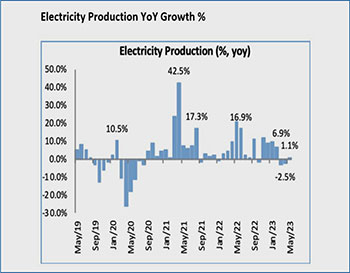
Electricity Production YoY Growth %
- Electricity production marginally grew by 1.1% YoY in May’23 vs.
-2.5% YoY in Apr’23 and - 3% YoY in Mar’23. The electricty
production is up due to high demand during summers
- The previous year saw weak production on account of coal shortages
and resultant weak generation at both domestic and imported coal
power plants.
|
To know your fund performance & NAV Click here
|

|
|
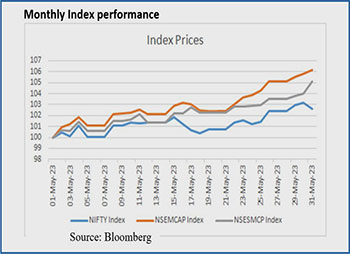
Monthly Index performance
- Equity markets posted a positive month in May’23 with midcap and
smallcap outperforming large cap indices. Nifty 50 closed the month
with a return of 3% while CNX Midcap Index gave a return of 26%
and Small Cap at 5%.
- Auto sector was the best performing sector gaining 4.75% followed
by Real estate, IT and Consumer Durables sector. Metals sector was
the biggest underperformer correcting by 6.13% followed by Oil &
gas and Capital goods sector.
|
|
|
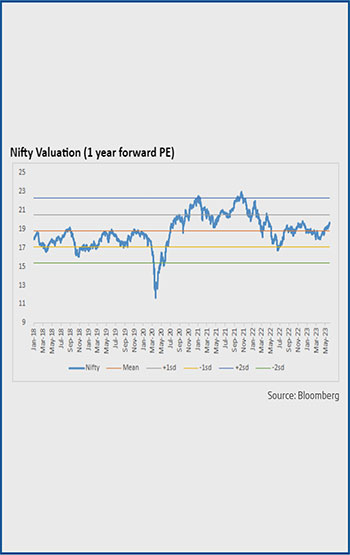
Nifty Valuation (1 year forward PE)
- India’s macroeconomic outlook has improved with a relatively
comfortable ination trajectory and an improving outlook on current
account decit. The interest rates seem to have peaked in the
current cycle in our view. RBI has also paused its rate hike cycle at its
April and June meetings
- Q4FY24 earnings clearly suggested a divergence between domestic
and global oriented sectors. Export oriented sectors (IT, pharma,
chemicals) saw meaningful earnings cuts with most companies
guiding for subdued outlook. However, for domestic oriented
companies demand improved (although not fully recovered), with
domestic auto, industrials and nancials posting strong topline along
with healthy order inows. Apart from this, margins (which were sour
point over the last year) seem to be improving for domestic oriented
companies as input price pressures fade. This divergence is reected
in earnings downgrades trend as well which saw exporters and
commodity company earnings getting downgraded but nancials and
domestic auto sector earnings witnessed upgrades.
- Over FY23-25, Nifty earnings are projected to grow at ~15%. Nifty is
currently trading at a valuation of ~17.0x FY25. 1-yr forward
valuations are higher that long term averages. Nonetheless, medium
term outlook remains quite strong and hence long-term investors
should use the current volatility to add to equities.
|
To know your fund performance & NAV Click here
|

|
|
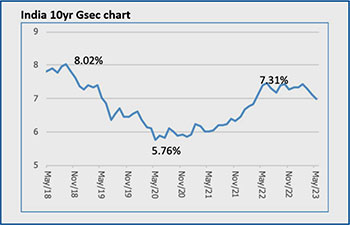
India 10yr Gsec chart
- Global bond yields rose last month. In the May FOMC meet, at the
beginning of the month, the Fed raised its benchmark borrowing rate
by 25 bps to 5.00%-5.25% in line with market expectation
- Contrary to the rest of the world, Indian bond yields continued to fall
on robust domestic demand, as the month had large bond maturities,
helping keep the net supply of bonds quite low.
|
|
|
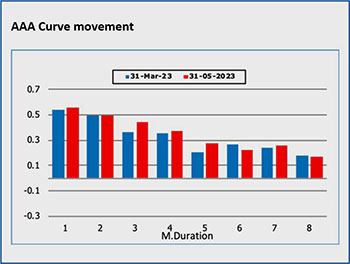
AAA Curve movement
- In May, the US 10yr yield rose sharply and touched a high of 3.83%
before closing at 3.64% higher than its previous close of 3.42%. The
domestic 10yr benchmark bond saw a sharp fall, as it touched a low of
6.94% during the month but closed at 6.99% against 7.12% at the
end of the previous month.
|
|
|
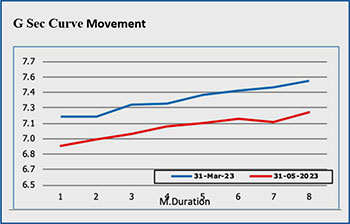
G Sec Curve Movement
- With May having low net supply of government bonds, net demand
outpaced net supply of bonds, helping the fall in bond yields.
However pent-up demand from mutual funds, insurance companies
and large pension funds is likely to wane gradually as net supply of
bonds increase in the coming months due to low maturities.
- With risks evenly balanced, bond markets are likely to be in a tight range unless surprised by large deviations in ination / growth.
|
To know your fund performance & NAV Click here
|

|
|
Data Source:Bloomberg
This document is for information and illustrative purpose only. Any advice, opinion, statement of expectation, forecast or recommendation mentioned herein shall not amount to any form of guarantee that HDFC Life Insurance Company Limited (“HDFC Life”) has determined or predicted future events or circumstances.
HDFC Life Insurance Company Limited ("HDFC Life") CIN: L65110MH2000PLC128245, IRDAI Reg. No. 101.
Regitered Office: 13th Floor, Lodha Excelus, Apollo Mills Compound, N.M. Joshi Marg, Mahalaxmi, Mumbai - 400 011.
Email: [email protected], Tel No: 1860-267-9999. Availble Mon-Sat from 10 am to 7 pm. (Local charges apply).
Do Not prefix any country code e.g. +91 or 00, website: www.hdfclife.com
The name/letters "HDFC" in the name/logo of the company belongs to Housing Development Finance Corporation Limited ("HDFC Limited") and is used by HDFC Life under an agreement entered into with HDFC Limited.
|